Mojotone Princeton Reverb Clone Project
Audio signal trace
On this page we trace the path of the audio signal through the amp.
Here is a high-level block diagram of the amp's audio signal path:
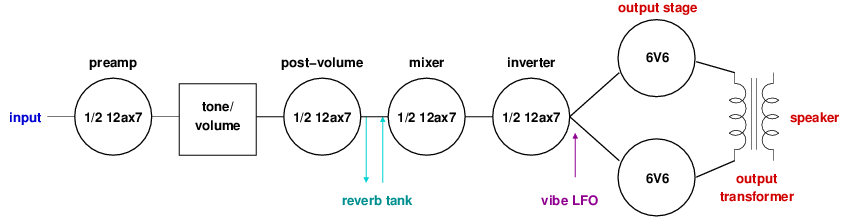 Audio signals enter the amp through one of the two input jacks and
are directly connected to the grid input of one of the triodes in
the 12ax7 (or 7025) preamp tube. The main difference between the
two input jacks is the resistors: channel one has a higher resistance
to ground so more of the audio signal makes its way into the amp.
After exiting the preamp, the audio signal then goes through the
tone stack and then the volume potentiometer. The passive tone
stack reduces the level of the audio signal, so the output of
the volume pot is sent to the post-volume 12ax7 triode to reamplify
it. The output of the post-volume 12ax7 tube forks off a path to
the reverb circuit and then returns to join with the original
signal on the input of the mixer 12ax7 triode. The output of
the mixer 12ax7 triode is then fed into the input of the inverter
12ax7 triode. The inverter tube outputs two audio signals where
one signal is out of phase with the other. Out of phase audio
signals are used to drive the output tubes of a push-pull style
amplifier like the Princeton. The low-frequency oscillator output
of the vibe circuit is also fed into the inputs of the output
tubes to modulate the volume. Finally, the output of the 6V6
power tubes is fed into the primary side of the output transformer
to convert the high-voltage low-current output of the 6V6's
into a low-voltage high-current signal that is suitable for driving
the amp's speaker.
To trace the audio path, I used an audio signal generator generating
a sine wave as input to the amplifier. Instead of a speaker, I connected
a dummy load to the amp output so that I would not have to listen to
a sine wave while conducting tests.
Audio signals enter the amp through one of the two input jacks and
are directly connected to the grid input of one of the triodes in
the 12ax7 (or 7025) preamp tube. The main difference between the
two input jacks is the resistors: channel one has a higher resistance
to ground so more of the audio signal makes its way into the amp.
After exiting the preamp, the audio signal then goes through the
tone stack and then the volume potentiometer. The passive tone
stack reduces the level of the audio signal, so the output of
the volume pot is sent to the post-volume 12ax7 triode to reamplify
it. The output of the post-volume 12ax7 tube forks off a path to
the reverb circuit and then returns to join with the original
signal on the input of the mixer 12ax7 triode. The output of
the mixer 12ax7 triode is then fed into the input of the inverter
12ax7 triode. The inverter tube outputs two audio signals where
one signal is out of phase with the other. Out of phase audio
signals are used to drive the output tubes of a push-pull style
amplifier like the Princeton. The low-frequency oscillator output
of the vibe circuit is also fed into the inputs of the output
tubes to modulate the volume. Finally, the output of the 6V6
power tubes is fed into the primary side of the output transformer
to convert the high-voltage low-current output of the 6V6's
into a low-voltage high-current signal that is suitable for driving
the amp's speaker.
To trace the audio path, I used an audio signal generator generating
a sine wave as input to the amplifier. Instead of a speaker, I connected
a dummy load to the amp output so that I would not have to listen to
a sine wave while conducting tests.
Preamp
The first figure shows the input from the signal generator in
yellow and the output of the preamp triode in blue. Note that
the signals are on different scales with the yellow on 100mV per
block and the blue on 5V per block, so the yellow input signal is
119mV RMS and the blue output signal is 6.01V RMS. So the preamp
triode significantly amplifies the input signal as expected. It
also inverts the phase of the input signal.
The second figure adds a pink plot that shows the signal as it
enters the volume pot after exiting the tone stack. The treble
and bass potentiometers are both set to 5. Passing through
the passive tone stack has reduced the signal down to 668mV RMS.


Tone stack
The next four plots show the same three signals as the previous plot
with different tone settings on the treble and bass pots. The settings
are: treble 1/bass 5, treble 10/bass 5, treble 5/bass 1, treble 5/bass 10.
The plots clearly show that changing the tone knobs impacts both the
amplitude and phase of the signal coming out of the tone stack.


Post-volume output
On the next plot we move a probe so that the pink signal is now the
output of the post-volume triode. I adjusted the volume knob so
that the post-volume triode output level matches the input level
to the tone stack. To achieve this the volume knob needs to be set
at about 6.5.
 Using this configuration, I also made a table recording volume knob
settings and post-volume triode output voltages. From the table
you can see the logarithmic taper used on the volume pot. It also
shows volume levels 1 and 2 have about the same output.
Using this configuration, I also made a table recording volume knob
settings and post-volume triode output voltages. From the table
you can see the logarithmic taper used on the volume pot. It also
shows volume levels 1 and 2 have about the same output.
| Volume setting | Output (volts) |
Volume setting | Output (volts) |
| 1 | 0.15 | 6 | 4.88 |
| 2 | 0.15 | 7 | 7.83 |
| 3 | 1.16 | 8 | 16.8 |
| 4 | 2.49 | 9 | 24.5 |
| 5 | 3.71 | 10 | 33.8 |
Mixer
The next figure shows the output of the post-volume triode in
yellow, the input to the mixer triode in blue, and the output of
the mixer triode in pink. The difference between the yellow and
blue curves is due to the reverb tank circuit. The yellow curve
is 6.22 V RMS while the blue curve is 746 mV RMS. The pink curve
shows that mixer triode increases the signal back up to 25.7 V RMS.

Inverter
The next two plots show the output of the mixer in yellow, the
input to the inverter in blue, and the plate output of the inverter
in pink. The first plot is with the volume set to 4.5 and the
second is with the volume set to 6.5 where the signal starts to
distort some for the current input.

 The next figure is with the volume set to 5, and it shows the input
to the inverter in yellow and the two outputs of the inverter in
blue and pink. The input voltage is 15.9 V RMS. The output voltages
are 14.6 V RMS (blue, plate) and 14.9 V RMS (pink, cathode). This
shows that the inverter does not really amplify the signal much, it
just inverts it on one of the outputs.
The next figure is with the volume set to 5, and it shows the input
to the inverter in yellow and the two outputs of the inverter in
blue and pink. The input voltage is 15.9 V RMS. The output voltages
are 14.6 V RMS (blue, plate) and 14.9 V RMS (pink, cathode). This
shows that the inverter does not really amplify the signal much, it
just inverts it on one of the outputs.

Output stage
The next plot shows the input and output signals of the 6V6 power
tubes. The yellow and blue plots are the two input signals and
they are 14.7 V RMS and 15.0 V RMS respectively. The pink
and dark blue plots show the outputs of the power tubes. In this
case both output curves are 142 V RMS.

Output transformer
The next plot shows the inputs and outputs of the output transformer.
The yellow plot shows the 8.29 V RMS output signal of the output
transformer. The pink 144 V RMS and dark blue 145 V RMS plots show
the two inputs to the output transformer. The output transformer
takes a high-voltage low current signal as input and generates a
low-voltage high current signal as output to drive the speaker.

Vibe LFO
The next two plots show the LFO generated by the oscillator in the
vibe circuit. The first plot shows the LFO with the speed knob set
to 1, while the second plot shows the LFO with the speed knob set to 10.
The horizontal scale of these plots is 50msec per block. The cycle
time of the LFO with speed 1 is about 275 msec, while the cycle of the LFO
with speed 10 is about 100 msec.

 Here is a table with LFO cycle times for a full range of speed knob
settings.
Here is a table with LFO cycle times for a full range of speed knob
settings.
| Speed setting | Cycle time (msec) |
Speed setting | Cycle time (msec) |
| 1 | 275 | 6 | 138 |
| 2 | 263 | 7 | 125 |
| 3 | 225 | 8 | 113 |
| 4 | 175 | 9 | 100 |
| 5 | 150 | 10 | 100 |
Input to speaker
The next four plots show the overall input to output signal with various
volume settings. The yellow plot in the first figure shows the input
signal which is 115 mV RMS. The next three plots show the output signal
at volume levels 6, 8, and 10 respectively. These plots show how the
input signal distorts at higher volume levels.


Reverb
The next two plots show the speaker output using the same yellow input
signal as show above. We set the volume to 6 to keep the signal from
being distorted. The first plot shows the output signal with the reverb
set to 5. The second plot shows the output signal with the reverb set
all the way up to 10.

 Return to main page
This page maintained by Chuck Cranor